

📊 Full opportunity report: Bitcoin Battles Unfold in Live Warzone Visualization on ThorstenMeyerAI.com — validation score, market gap, and execution plan.
TL;DR
A new browser-based project visualizes Bitcoin trading as a live warzone, depicting buyer-seller battles and market volatility. It uses real-time data from Binance and Coinbase, offering an immersive experience without trading features.
The ‘Bitcoin War’ visualization, launched recently by isbitcoindead.com, offers a live, cinematic depiction of Bitcoin trading activity, transforming real-time market data into a dynamic battlefield scene. This innovative project is designed for visual and data enthusiasts to observe market fluctuations as a visceral war, with no trading or financial advice involved.
The visualization connects directly to the public Binance trade stream via WebSocket, with a fallback to Coinbase, ensuring continuous data flow. Each market tick becomes a combatant: buy orders from the Cobalt Host push the front line from the left, while sell orders from the Ember Legion push from the right. Large liquidations are visualized as airstrikes, adding visceral impact. The entire system runs client-side, utilizing Canvas 2D graphics, WebAudio synthesis, and real-time stream processing, with a minimal footprint of approximately 180KB.
An automatic camera system shifts perspectives between broad views and detailed skirmishes, while a live DEFCON meter indicates volatility levels. A scrolling log narrates ongoing market conflict, and a browser-generated soundtrack heightens the tension. A comprehensive scoreboard tracks seconds won, casualties, and dollar gains, creating a compelling visual narrative of market dynamics. Importantly, the project is explicitly non-trading: it does not involve wallets, signals, or investment advice, emphasizing its artistic and educational purpose.
Implications of Visualizing Market Chaos as a War Scene
This project demonstrates how advanced web technologies can be harnessed for creative data visualization, providing an artistic lens on the chaos of markets. It offers a novel way to understand market volatility and buyer-seller interactions without offering investment advice. For traders, researchers, and enthusiasts, it provides a visceral, immersive experience of market dynamics, highlighting the raw intensity of Bitcoin trading.
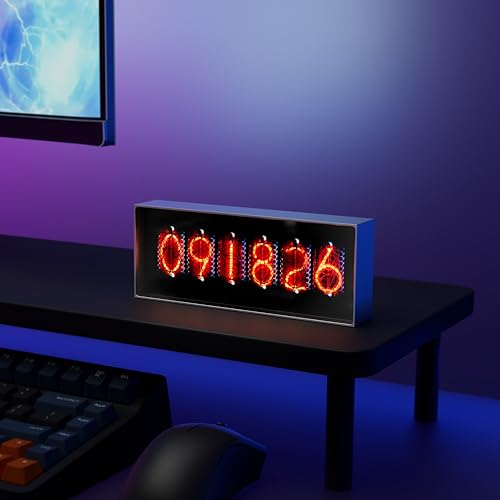
Electronic Display for Real-Time Cryptocurrency/Bitcoin/Stock Market Data, Time, Weather & Temperature, 164*28*65mm, Supports Image Upload and 30s Video Playback, App-Controlled, 960*360 Resolution
- Real-Time Data Display: Cryptocurrency, stock, time, weather updates
- Custom Image & Video Upload: Upload images and 30s videos
- App-Controlled Management: Control content and display modes
As an affiliate, we earn on qualifying purchases.
As an affiliate, we earn on qualifying purchases.
Background and Development of the Bitcoin War Visualization
The visualization was developed by isbitcoindead.com as an experimental project to represent Bitcoin trading activity through a cinematic, real-time display. It leverages browser-native technologies to create an immersive experience without backend infrastructure, showcasing the potential of WebSocket streams and client-side rendering. The concept aligns with broader trends in data art and market visualization, aiming to make complex market activity accessible and engaging to a wider audience.
“The visualization aims to turn market data into a visceral experience, illustrating the ongoing tug-of-war between buyers and sellers in real-time.”
— an anonymous researcher
cryptocurrency trading data display
As an affiliate, we earn on qualifying purchases.
As an affiliate, we earn on qualifying purchases.
Unconfirmed Aspects and Technical Limitations
It is not yet clear how accurately the visualization reflects actual market conditions over extended periods or during high volatility spikes. The project is primarily aesthetic and illustrative, not a predictive or analytical tool. Details about its scalability, potential integration with other data sources, or future updates remain undisclosed.
As an affiliate, we earn on qualifying purchases.
Future Developments and Potential Expansions
Developers may expand the visualization’s features, such as adding different market scenarios or integrating more data streams. There is also potential for further public engagement, educational use, or even experimental trading simulations based on the visualization. However, no official roadmap or timeline has been announced.
As an affiliate, we earn on qualifying purchases.
Key Questions
Is the Bitcoin War visualization a trading tool?
No, it is purely a visual and artistic representation of market activity. It does not involve trading, wallets, or investment advice.
How does the visualization work technically?
It connects directly to Binance and Coinbase trade streams via WebSocket, rendering real-time data into a cinematic battlefield using Canvas 2D graphics and WebAudio in the browser.
Can I use this visualization on any device?
Yes, it runs in any modern browser that supports WebSocket, Canvas, and WebAudio technologies. It is designed to be accessible and lightweight.
Does the project provide market analysis or predictions?
No, it is an artistic visualization without analytical or predictive functions. Its purpose is to illustrate market activity visually.
Will there be future updates or features?
There has been no official announcement about future features or updates. The current version is a demonstration of web-based visualization technology.
Source: ThorstenMeyerAI.com